Analytics dashboard
Updated June 25, 2026
The dashboard is your overview. It answers one simple question: what is Navi actually doing for you?
Pick the period
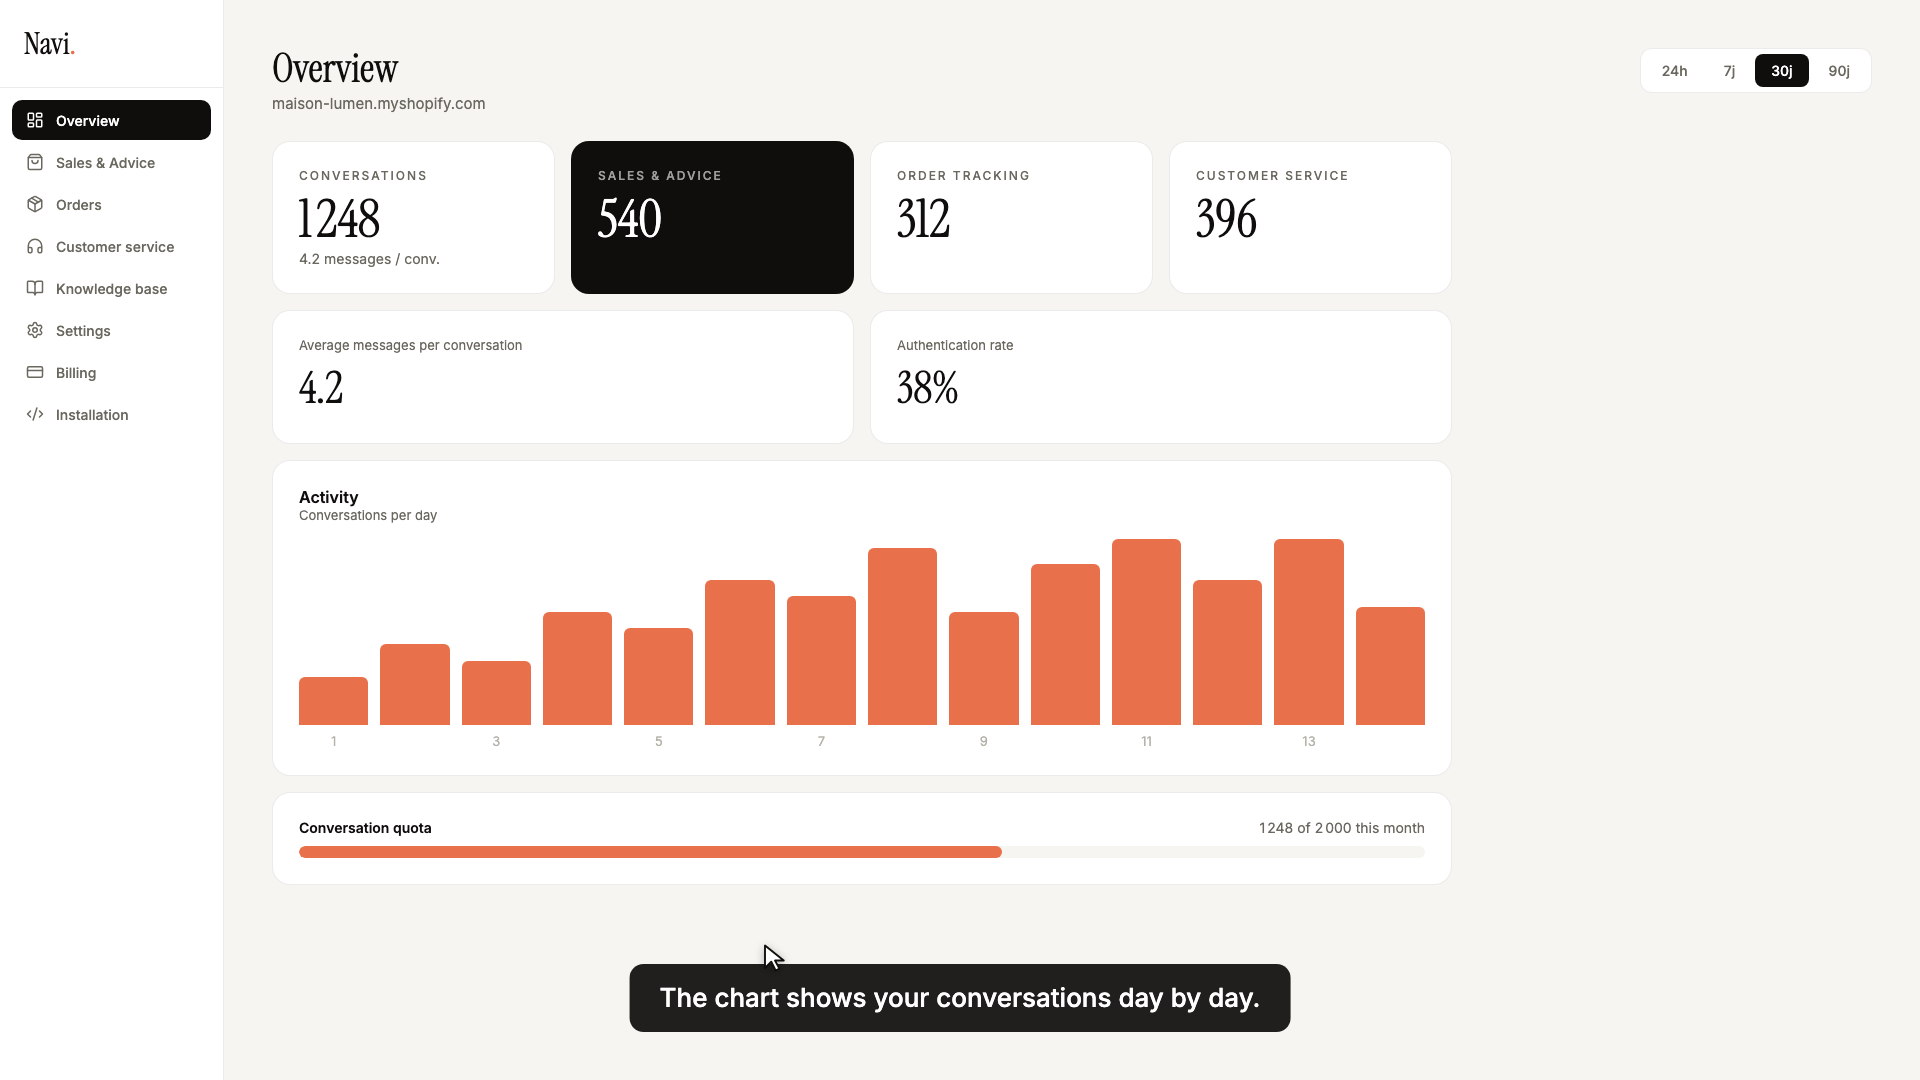
At the top, the period selector adjusts the whole screen: 24h, 7 days, 30 days, 90 days. Numbers and charts recompute over the window you choose.
What you see
- Key metrics — the volume of conversations over the period, and the figures that matter to you.
- Conversations per day — the day-by-day trend, to spot spikes.
- Topic breakdown — what your customers come to Navi for (sales, tracking, support…).
- Recent activity — the latest events, as they happen.
- Quota — where you stand on this month's volume (covered in Manage your conversation quota).
One conversation = one visitor over 24 hours, no matter how many messages. It's the same unit everywhere: dashboard, quota, billing.
Next
To understand how that volume is counted and what happens at the limit, see Manage your conversation quota.